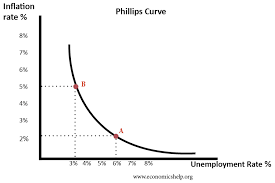
Phillips curve
It exhibits relation between rate of unemployment (or the rate of change of unemployment) and the rate of change of money wages ( rate of inflation). In other words, there is a trade-off between unemployment and inflation. It was first studied by economist A. William Phillips, and named after his name Phillips Curve. The curve is showing negative relation, that is it indicates when wages tend to rise unemployment tends to fall.
It exhibits relation between rate of unemployment (or the rate of change of unemployment) and the rate of change of money wages ( rate of inflation). In other words, there is a trade-off between unemployment and inflation. It was first studied by economist A. William Phillips, and named after his name Phillips Curve. The curve is showing negative relation, that is it indicates when wages tend to rise unemployment tends to fall.

Early 1970s, marked by relatively high unemployment and high inflation or wage increases, which digressed from Phillips curve. At the beginning of the 21st century, the persistence of low unemployment and relatively low inflation marked another departure from the Phillips curve.
-
Know more
The main implication of the Phillips curve is that, to reduce unemployment a particular rate of wage increase or inflation has to bear. The twin goals of low unemployment and a low rate of inflation may not be compatible. However, the great oil shock has falsified the Phillips curve. It raised question on the infallibility of Keynesian theory. It also harbingers the decline of Keynesian theory. A new era of monetarists’ theory gained the traction in macroeconomics.

